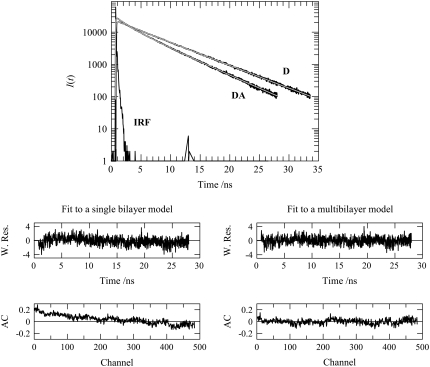
FIGURE 3.
(Upper) BODIPY-PC fluorescence decays in absence (donor only (D)) and presence (donor + acceptor (DA)) of Rh-PE (1:1000 and 1:400 relative to total lipid for donor and acceptor, respectively) in 4:1 POPC/POPS LUVs (total lipid 215 μM), in the presence of 9.0 μM lysozyme. Also shown are the global fits using the multibilayer model of Fig. 1 B and Eq. 9 (smooth gray lines) and the instrument response function (IRF). (Middle) Weighted residual plots for the fits of the single bilayer (left; see Fig. 1 A and Eq. 3) and multibilayer (right; see Fig. 1 B and Eq. 9) models to the DA decay shown in the upper panel. (Lower) Autocorrelation plots for the fits of the single bilayer (left; see Fig. 1 A and Eq. 3) and multibilayer (right; see Fig. 1 B and Eq. 9) models to the DA decay shown in the upper panel.

