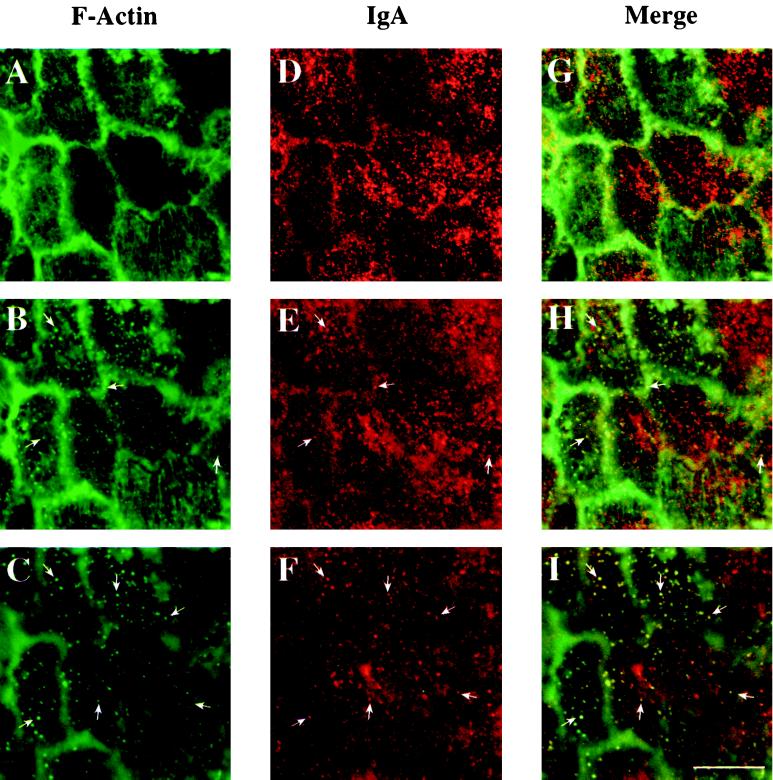
Figure 10.
Distribution of IgA and F-actin in RhoAV14 grown in the presence of 20 ng/ml DC. IgA was internalized for 10 min at 37°C from the basolateral surface of RhoAV14 cells grown in the presence of 20 ng/ml DC, and the cell surface ligand was removed by trypsin treatment at 4°C. Cells were fixed with paraformaldehyde, incubated with rabbit anti-IgA antibody, and then reacted with goat anti-rabbit Cy5 secondary antibody and FITC-phalloidin. The FITC and Cy5 emissions were captured simultaneously with the use of a scanning laser confocal microscope. Single optical sections were taken at the very base of the cell (C, F, and I), 1 μm above the previous section (B, E, and H), and at a focal plane where the phalloidin-labeled stress fibers appeared maximally in focus (A, D, and G). Examples of IgA and F-actin colocalization are marked with arrows. Bar, 10 μm.

