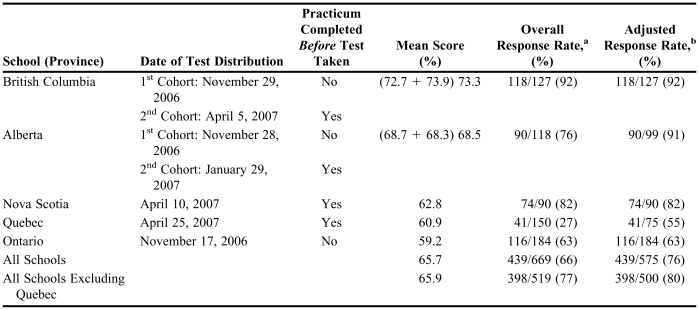
Table 2.
Mean Scores and Response Rates for Each School
aNumber of students who took the test/all 4th year students enrolled at that school
bNumber of students who took the test/students enrolled in the class in which the test was given. Accounts for schools where test was not given in core class, and some students did not have the opportunity to take the test. Does not account for students who skipped class the day of the test

