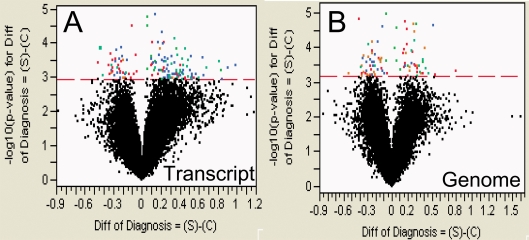
Figure 9. Volcano plot of analysis of variance of log10-transformed, transcript- (A) and genome-aligned read frequencies (B), showing genes with FDR-corrected differences in LSMeans.
The x-axis shows the magnitude of the difference between 14 cases (S) and 6 controls (C), while the Y-axis shows the −log10(p value) for those differences. The red dashed line indicates the significance cutoff for differences with a control (−log10(p value) 3.17 for genome alignments and 2.94 for transcript alignments).

