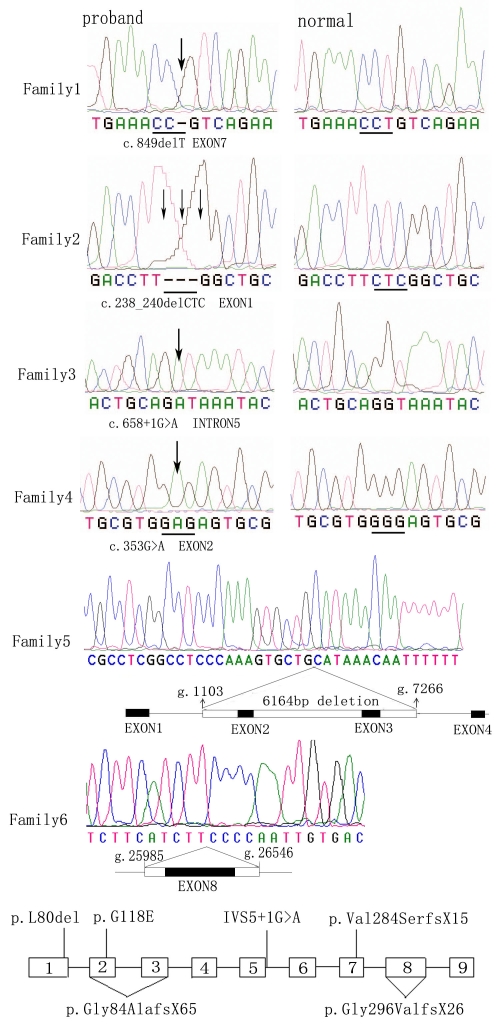
Figure 4.
Sequencing analysis of six families with OA1. The mutant GPR143 sequence (left) and corresponding normal sequence (right) are shown for families 1–4. The exact mutation is labeled under each sequence according to the nomenclature recommended by Human Genomic Variation Society (HGVS). Each mutation is marked with an arrow. In family 5, direct sequencing image was obtained by direct sequencing. The long band in Family 5 including exons 2 and 3, represents the large intragenic deletion region, which encompasses about 6,164 bp from g.1103 to g.7266 of GPR143. In family 6, direct sequencing image was obtained by direct sequencing, and the lower long band represents the deletion from g.25985 to g.26546 encompassing exon 8. The location of the six mutations within GPR143 is exhibited at the bottom of the Figure 4. Exons are shown as open boxes numbered 1–9, and thin lines represent introns. The locations of the six mutations found in this study are indicated beside the exons.

