
Fig. 3.
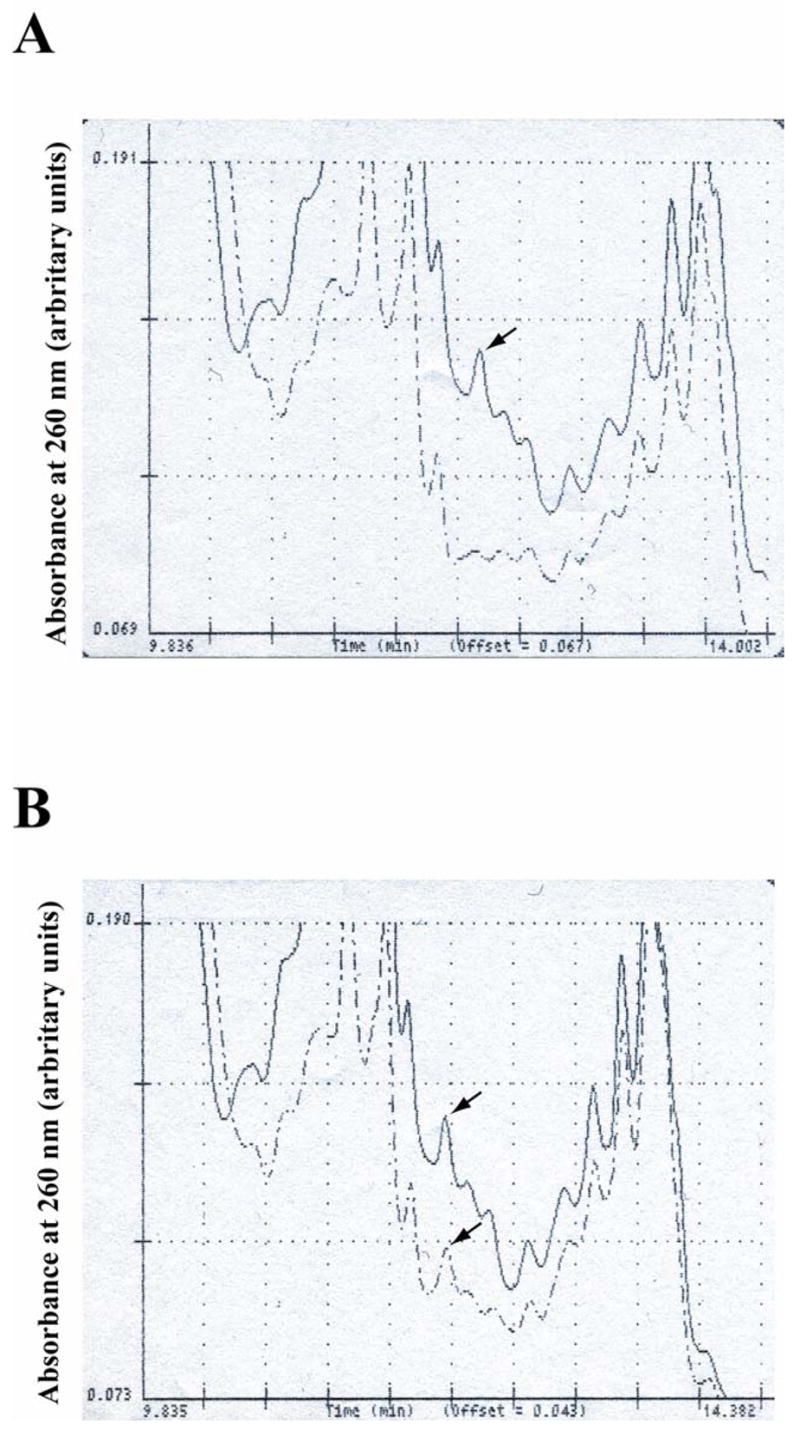
HPLC profiles of supernatants from cultures of 775 and mutant derivatives. Panel A. Detail (from min 9.836 to min 14.002) of the HPLC profiles of supernatants from 775 (continuous line) and 775(pJM1#120), dashed line. The arrow points to the anguibactin peak. Panel B. Detail (from min 9.835 to min 14.382) of the HPLC profiles of supernatants from 775 (continuous line) and 775(pJM1#120/pMDL30), dashed line. The arrows point to the anguibactin peak. Shown are representative HPLC profiles.