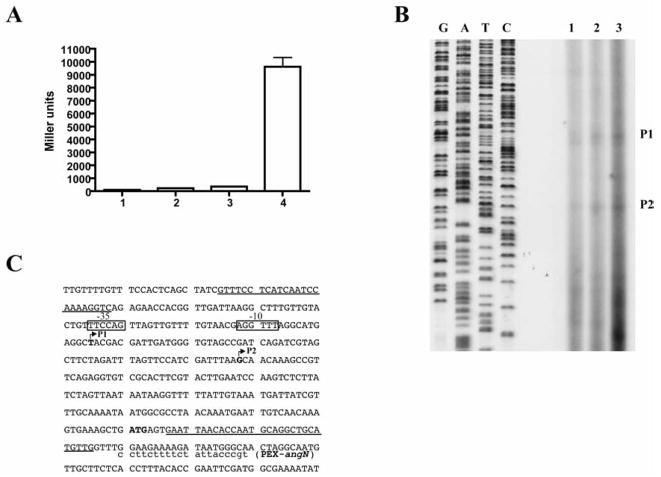
Fig. 5.
Mapping of angN promoter and the transcription start sites of angN mRNA. Panel A. β-galactosidase assays with V. anguillarum strains (lanes 1 and 2, 775 pTL61T; lanes 3 and 4 775 pHNN-2) grown in iron rich (4 μg/ml ferric ammonium citrate) or in iron-limiting (0.5 μM EDDA) conditions. Panel B. Primer extension analysis using a primer complementary to the 5′-end of the angN gene and RNA obtained from cultures grown in iron rich (lane 1, 2 μg/ml ferric ammonium citrate) and in iron-limiting conditions (lane 2, 1.5 μM EDDA; lane 3, 2 μM EDDA). Lanes G, A, C and T represent the sequence of plasmid pMDL6 using primer PEX-angN. P1 and P2 are putative transcription start sites for the angN gene. Panel C. The nucleotide sequence of the region upstream of the angN gene is shown with the primer used in the primer extension experiment and the location of the putative transcription starts (arrowheads P1 and P2 and bold letters). The –35 and –10 sequences for the P1 product are shown as open boxes and the ATG for AngN is in bold. The sequences corresponding to the primers used to construct the lacZ-fusion are underlined.

