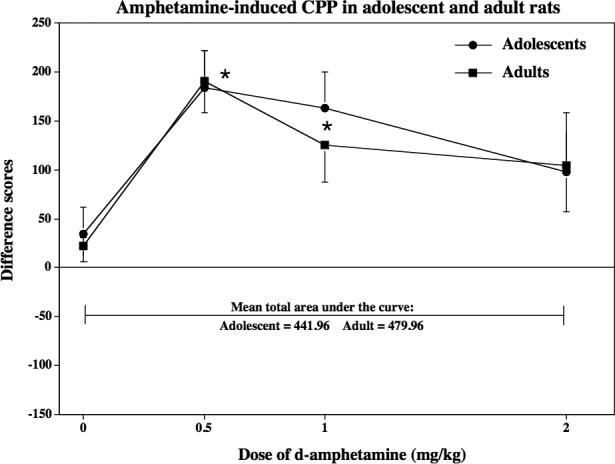
Fig 2.

This graph reflects amphetamine-induced CPP in naïve adolescent and adult rats (n=7−14) that were conditioned with various d-amphetamine doses (0, 0.5, 1.0 or 2.0 mg/kg, sc). These data are presented as difference scores (±SEM), which reflect time spent in the initially non-preferred side after conditioning minus before conditioning such that values above “0” reflect a positive shift in preference (i.e., CPP). Mean total area under the curve reflects the sum of the averages for each age group from the 0 to 2.0 mg/kg dose of d-amphetamine. The asterisks (*) denote a significant difference from their respective saline control group (p ≤ 0.05).
