
Figure 2.
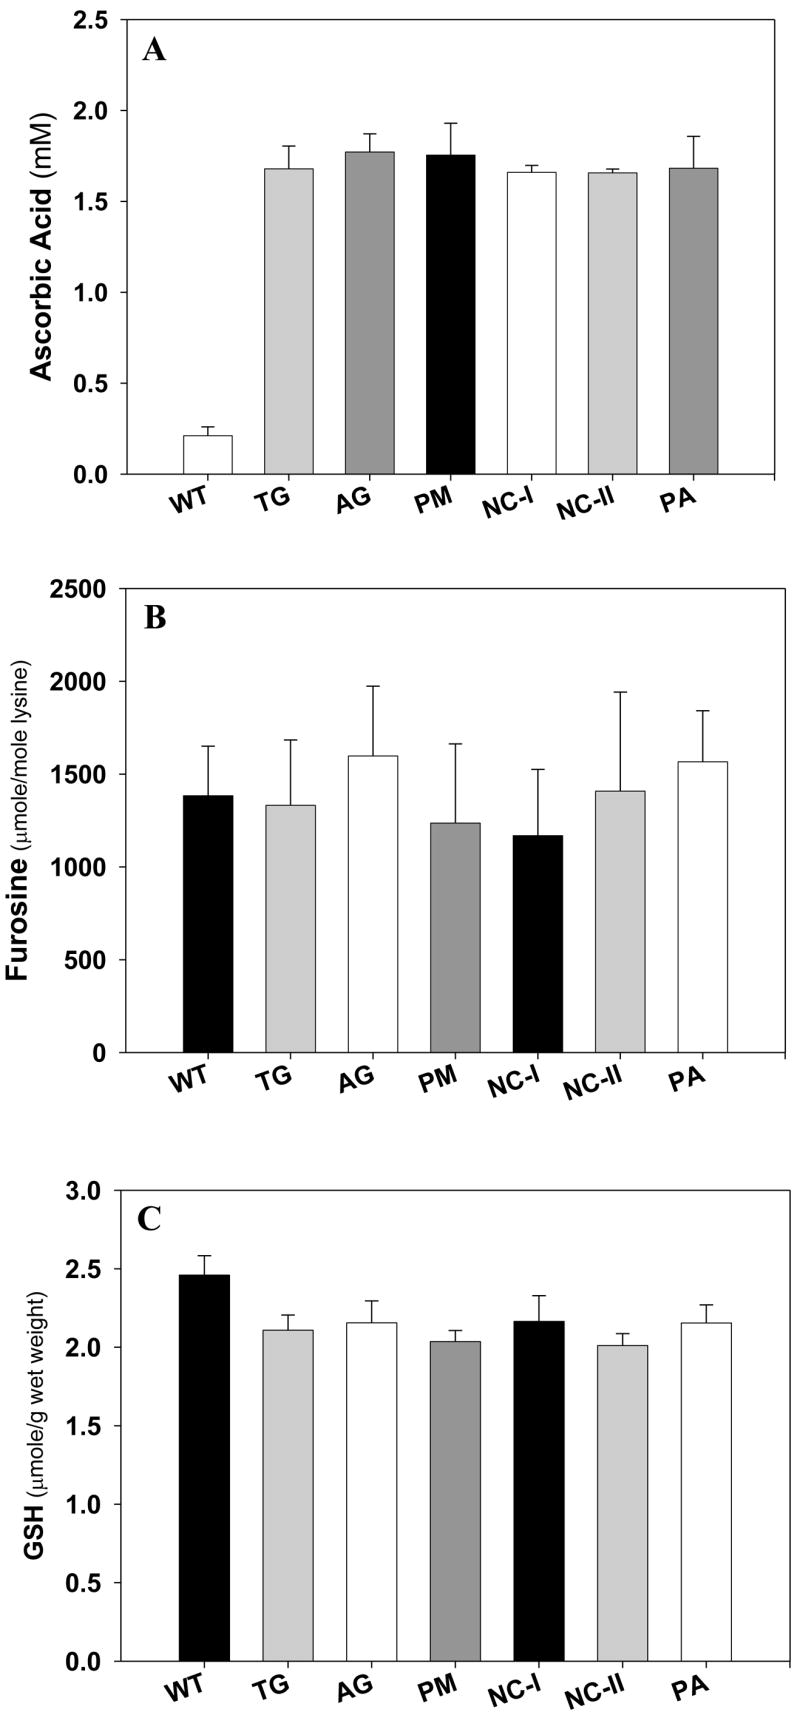
Lens ascorbic acid, glutathione (GSH) and protein bond furosine level in vivo. Mouse lens was homogenized and extracted by 10% TCA. The supernatant was used for GSH and ASA assay and the protein pellet was hydrolyzed for fructosamine (furosine assay), a marker mean glucose levels. (a). Lens ascorbic acid level. (b) lens GSH level. (c) furosine level. Student’s t test was used for all comparisons. (n=10 mice per group).