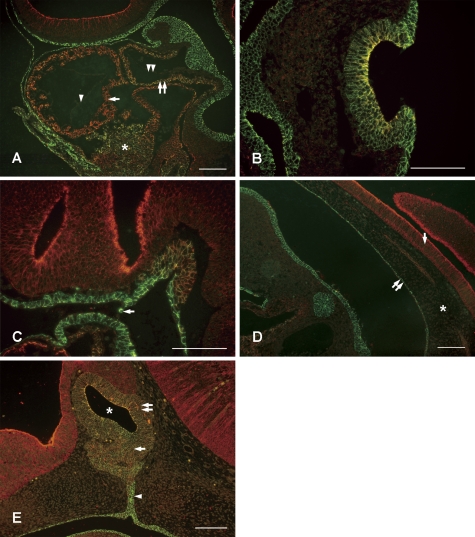
Fig. 2.
Double fluorescent immunohistochemistry for E-cadherin and N-cadherin of embryonic organs. Immunoreactivity of E-cadherin and N-cadherin are shown in green and red, respectively. A: Bulbus cardialis at E11. The single arrow indicates the developing myocardial layer, the double arrow indicates the aortic sac smooth muscle layer, and the asterisk septum transversum tissue. Although both E- and N-cadherins were expressed in these tissues, the endocardium (single arrowhead) and aortic sac tunica intima (double arrowhead) expressed neither cadherin. B: Otic pit at E11. The surface ectoderm expressed only E-cadherin, and the otic pit expressed both E- and N-cadherins. C: Notochord (anterior) at E10. The arrow indicates the oral pharyngeal membrane. Cells expressing E- and N-cadherins were observed up to the prechordal plate. D: Notochord (posterior) at E10. The chorda dorsalis expressed E- and N-cadherins, and was independent of the neural tube (single arrow) and the midgut (double arrow). The asterisk indicates the interstitium. E: Rathke’s pouch at E14. Several layers of cells facing the lumen of Rathke’s pouch (asterisk) strongly expressed E- and N-cadherins. Note the variation in the expression ratio of E- and N-cadherins in the prospective pars distalis (single arrow) and pars intermedia (double arrow). An arrowhead indicates the pharyngohypophyseal stalk. Bars=100 µm.

