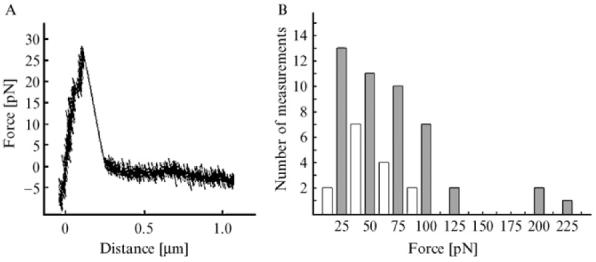
Fig. 8.

(A) Typical force-versus-distance graph from a measurement on a single bacterium of the 17875Leb strain. The force increases linearly force until the binding breaks. (B) Histogram of the distribution of rupture forces from in total 61 measurements on the 17875Leb strain. The intervals are centered at multiples of 12.5 pN with a width of ±6.25 pN. Most of the rupture forces appear in the even intervals (marked with filled bars). This suggests the existence of an elemental force in the system of ∼25 pN, which is interpreted as the rupture force of a single BabA-Leb binding.
