
Table 3.
Effect of the aqueous (a) and chloroform (c) extracts from the biomass and the extract from the culture liquid (e) on the growth of test organisms
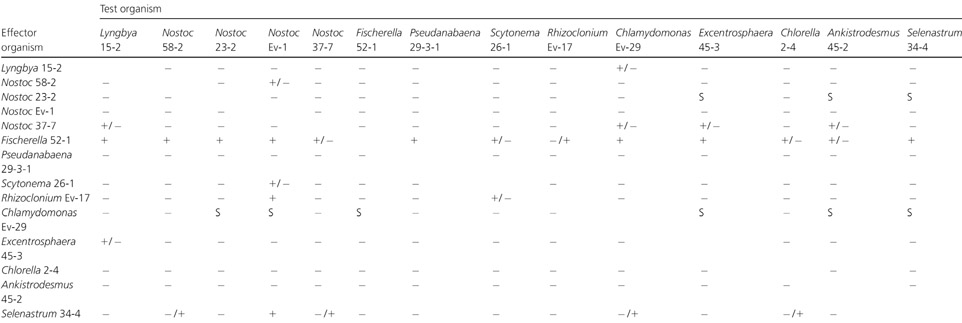 |
The symbols represent a range of inhibition zones obtained as means from three replicates.
+, inhibition zone > 15 mm; +/−, weak inhibition zone 10−15 mm; −/+, very weak inhibition zone < 10 mm; −, no effect; S, stimulation.