
Table 4.
Intention-to-Treat Analysis for the Randomized Cohort and Adjusted Analyses, According to Treatment Received, for the Randomized and Observational Cohorts Combined.*
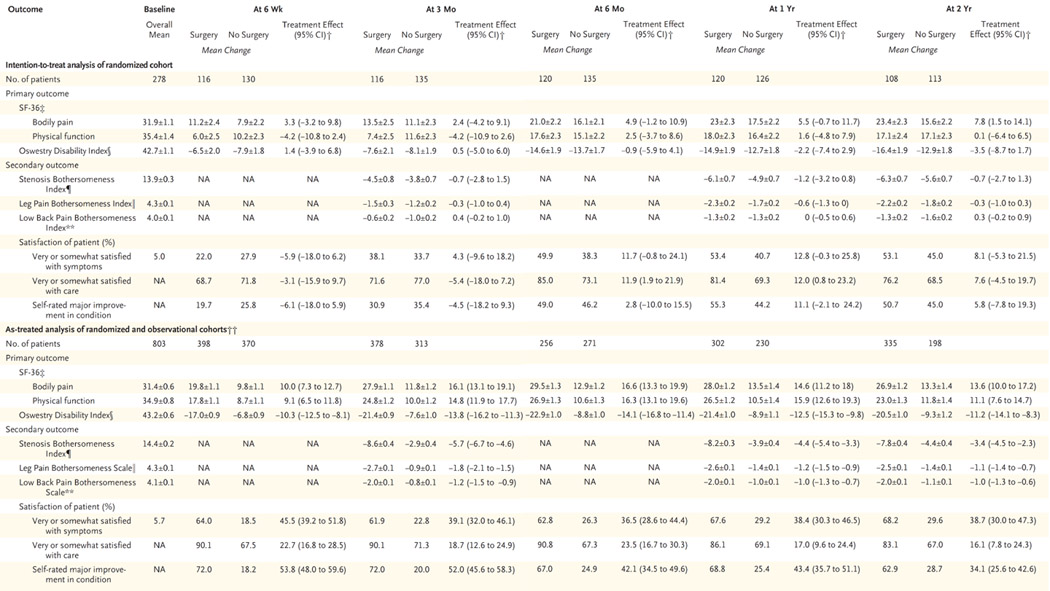 |
Plus—minus values are means ±SE. Values in the as-treated analysis have been adjusted for age, sex, the presence or absence of stomach or joint disorders, the presence or absence of pain on straight-leg raising or femoral-nerve tension signs, smoking status, patient-assessed health trend, income, other compensation, body-mass index, baseline score for the outcome variable, and center. NA denotes not available.
The treatment effect is the difference in the mean change from baseline between the surgical group and the nonsurgical group.
The SF-36 scores range from 0 to 100, with higher scores indicating less severe symptoms.
The Oswestry Disability Index ranges from 0 to 100, with lower scores indicating less severe symptoms.
The Stenosis Bothersomeness Index ranges from 0 to 24, with lower scores indicating less severe symptoms.
The Leg Pain Bothersomeness Scale ranges from 0 to 6, with lower scores indicating less severe symptoms.
The Low Back Pain Bothersomeness Scale ranges from 0 to 6, with lower scores indicating less severe symptoms.
The number of patients in the as-treated analyses reflects the number of patients contributing to the estimate in a given period with the use of the longitudinal-modeling strategy (explained in the Methods section) and may not correspond to the number shown for each visit time in Figure 1.