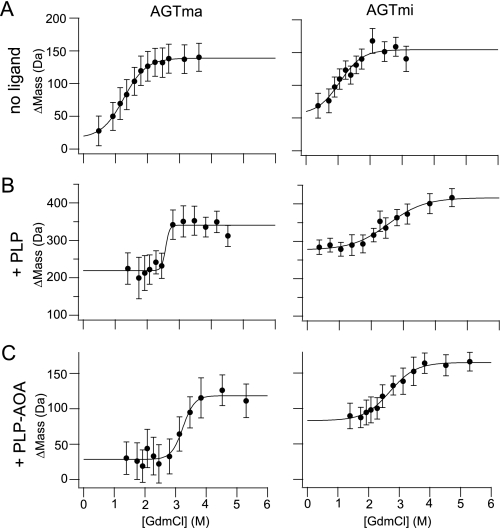
FIGURE 5.
SUPREX analysis of AGTma and AGTmi. AGTma and AGTmi (4 μm, with C-terminal His6 tags) were analyzed in the absence of added ligand (5 min of exchange time) (A), in the presence of 400 μm PLP (5 min of exchange time) (B), and in the presence of 400 μm PLP and 400 μm AOA (1 h of exchange time) (C). Graphs show changes in mass at increasing concentrations of guanidine hydrochloride (GdmCl).

