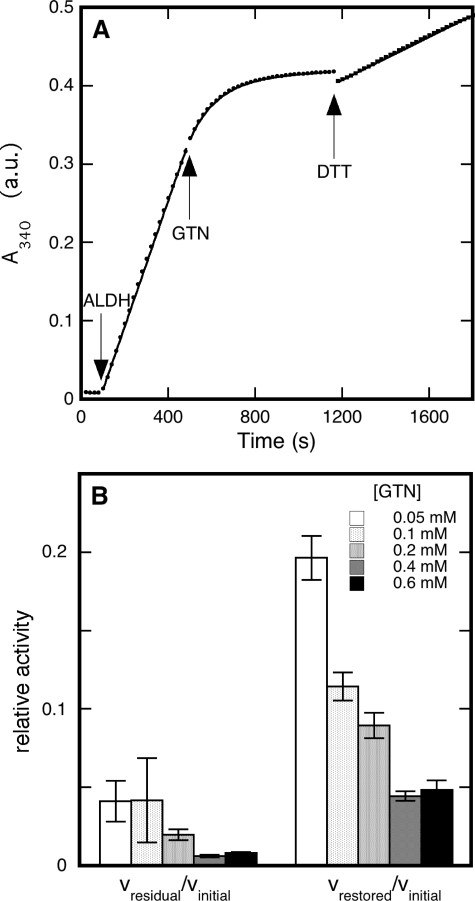
FIGURE 1.
Inhibition by GTN of ALDH2-catalyzed dehydrogenation of acetaldehyde. Panel A shows a time trace for the formation of NADH from NAD+, monitored at 340 nm. At t = 0 the cuvette contained 0.2 mm acetaldehyde and 0.2 mm NAD+ in 50 mm potassium Pi (pH 7.4). At t = 80 s, catalysis was initiated by the addition of 33 μg/ml ALDH2. Inactivation started at t = 480 s by the addition of 0.05 mm GTN. After inactivation of the enzyme, at t = 1160 s, an attempt was made to restore activity by the addition of 1 mm DTT. The dots represent the data points, whereas the continuous lines are best fits to the data. Linear fits were applied to the phases before (no catalysis (-0.10 ± 0.06) × 10-4 absorbance units (a.u.)/s), and after ALDH2 addition (initial activity, (8.03 ± 0.05) × 10-4 a.u./s), and to the activity after DTT admission (restored activity (1.378 ± 0.006) × 10-4 a.u./s); for the inactivation after GTN addition a combination of a single exponential and a linear fit was applied (apparent inactivation rate constant (7.77 ± 0.06) × 10-3 s-1; residual activity (0.133 ± 0.007) × 10-4 a.u./s). Panel B compares the residual and restored rates of acetaldehyde dehydrogenation after addition of GTN and DTT, respectively. Experimental conditions: 33 μg/ml ALDH2, 0.43 mm acetaldehyde, 0.4 mm NAD+, 0.4 mm DTT, and concentrations of GTN as indicated in 50 mm potassium Pi (pH 7.4). Initial dehydrogenase activities under the conditions applied here amounted to 289 ± 13 nmol min-1 mg-1, which corresponds to a turnover number of 69 ± 3 min-1.

