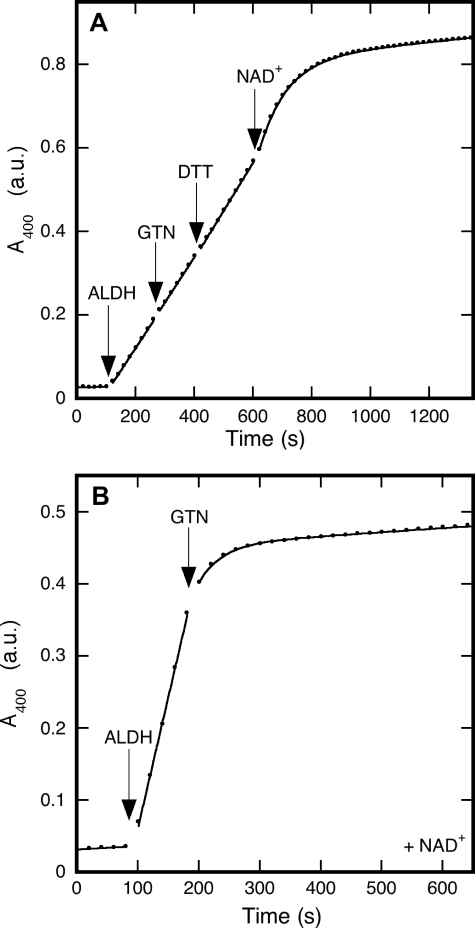
FIGURE 3.
Inhibition by GTN of ALDH2-catalyzed hydrolysis of p-nitrophenylacetate. The figure shows the formation of p-nitrophenol from p-NPA, as monitored at 400 nm. Panel A shows that, in the absence of NAD+, GTN did not significantly affect esterase activity. However, inactivation set in immediately after the addition of NAD+. Experimental conditions were: p-NPA (0.2 mm) in 50 mm potassium Pi (pH 7.4) was present at the start of the reaction; ALDH2 (33 μg/ml), GTN (0.1 mm), DTT (0.2 mm), and NAD+ (0.2 mm) were added as indicated. Curve fitting as described in the legend to Fig. 1 yielded (1.0 ± 0.5) × 10-5 absorbance units (a.u.)/s for the uncatalyzed reaction, (1.07 ± 0.02) × 10-3 a.u./s for the initial rate, (1.083 ± 0.008) × 10-3 a.u./s and (1.15 ± 0.01) × 10-3 a.u./s after addition of GTN and DDT, respectively, (1.051 ± 0.008) × 10-2 s-1 for the apparent inactivation rate constant after addition of NAD+, and (7.2 ± 0.1) × 10-5 a.u./s for the residual activity. Panel B demonstrates that GTN inactivates the enzyme in the presence of NAD+. Experimental conditions: p-NPA (0.2 mm) and NAD+ (0.2 mm) in 50 mm potassium Pi (pH 7.4) were present at the start of the reaction; ALDH2 (33 μg/ml) and GTN (0.1 mm) were added as indicated. Curve fitting yielded the following results: (0.048 ± 0.009) × 10-3 a.u./s for the uncatalyzed reaction, (3.65 ± 0.08) × 10-3 a.u./s for the initial activity, (2.6 ± 0.1) × 10-2 s-1 for the apparent inactivation rate constant, and (0.0567 ± 0.0008) × 10-3 a.u./s for the residual activity.

