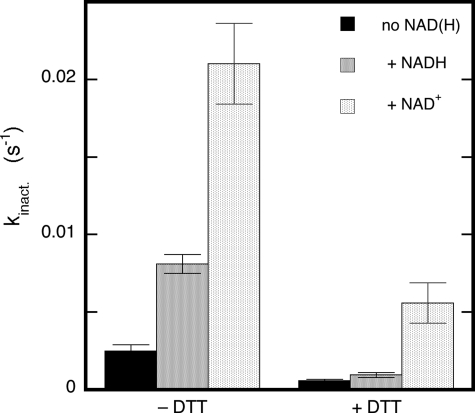
FIGURE 4.
Effect of NAD+ and NADH on the rate of inactivation by GTN of ester hydrolysis. The figure shows the effects of NAD+ and NADH (0.2 mm) on the apparent inactivation rate constant in the absence and presence of 0.4 mm DTT. Results are presented as averages ± S.E. (n = 3). Further conditions: 33 μg/ml ALDH2, 0.2 mm p-NPA, and 0.1 mm GTN in 50 mm potassium Pi (pH 7.4).

