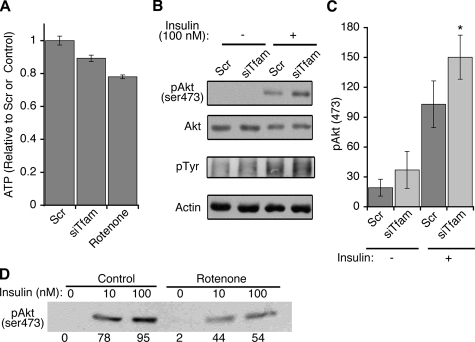
FIGURE 6.
ATP levels and insulin signaling in Tfam knockdown cells. A, cells were transfected with scrambled (Scr) or Tfam-directed (siTfam) siRNA oligonucleotides at day 2 of differentiation, and at day 6 ATP levels were determined by luminescence. Where indicated, rotenone (5 μm) was added to control cells for 60 min prior to measurement. Bars are means, and lines are ±S.E. of three experiments performed in triplicate. p values obtained by one-tailed paired Student t tests were 0.048 and 0.00018 Scr versus siTfam and control versus rotenone, respectively. B, cells prepared as above were stimulated with 10 nm insulin for 15 min and then harvested in lysis buffer with phosphatase and protease inhibitors. Western blots were performed using antibodies to phospho-Akt (serine 473) and phosphotyrosine antibody (4G10), respectively. Shown is the area of the gel (∼180 molecular weight) showing maximal stimulation in phosphotyrosine signal. Antibodies to total Akt and actin were used to control for loading. C, quantification of Akt phosphorylation from four independent experiments. *, p value obtained by one-tailed Student t tests was 0.031 for Scr versus siTfam in the presence of insulin. D, adipocytes at day 6 of differentiation were treated without (Control) or with 500 nm rotenone for 60 min, and then with the indicated concentrations of insulin for 15 min prior to lysis and Western blotting with anti-phospho Akt antibody. The values from the densitometry scan of this representative experiment are shown below each band.

