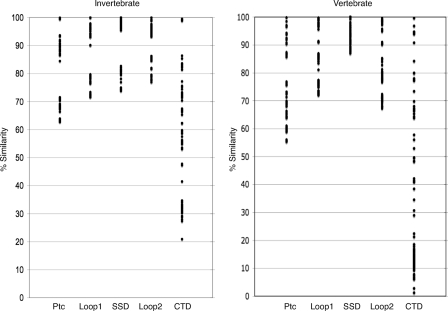
FIGURE 1.
Sequence variance in vertebrate and invertebrate Ptc proteins. The sequence similarity value of pairwise ClustalW alignments is plotted for the full-length proteins and for loop 1, the SSD, loop 2, and the CTD. Each circle represents a percent similarity value calculated for one of the pairwise comparisons among invertebrate (left) and vertebrate (right) proteins.

