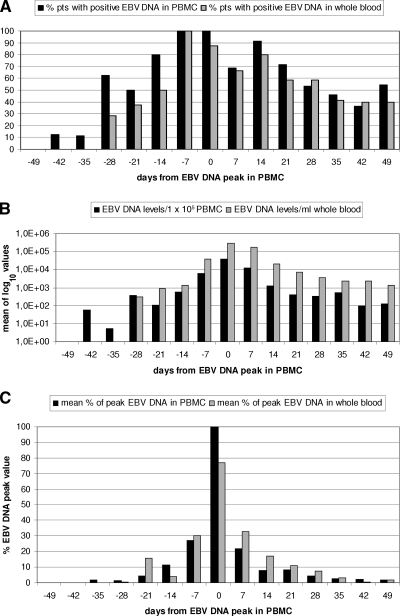
FIG. 2.
Kinetics of EBV DNA in PBMC and whole-blood samples of pediatric haploidentical HSCT recipients. (A) Percentages of patients (pts) positive for EBV DNA in PBMC (filled bars) and in whole blood (shaded bars) with respect to the time of peak levels in PBMC. (B) Mean log10 copies of EBV DNA in PBMC (filled bars) and in whole blood (shaded bars) with respect to the time of peak levels in PBMC. (C) EBV DNA levels expressed as mean percentages of peak EBV DNA levels in PBMC (filled bars) and in whole blood (shaded bars) with respect to the time of peak levels in PBMC.

