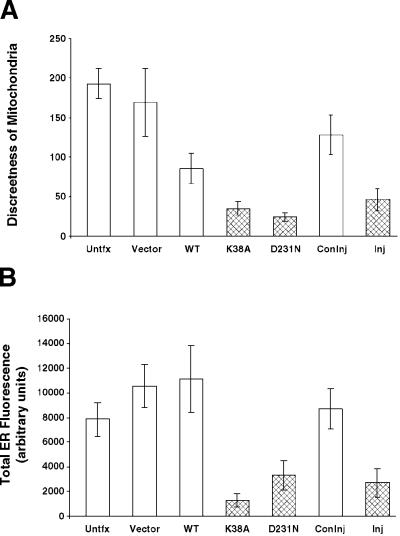
Figure 4.
Quantitation of altered mitochondrial and ER phenotypes in DLP1 mutant–expressing cells or DLP1 antibody–injected cells. (A) The mitochondrial phenotype was quantitated by generating objects that correspond to mitochondrial discreteness (see MATERIALS AND METHODS). These objects were counted, and the data are expressed as the mean number of mitochondria ± 95% confidence intervals. In mutant cells (stippled bars), there are fewer discrete mitochondria than in control cells (white bars). Cells injected with inhibitory DLP1 antibodies (Inj, stippled bar) show a similarly decreased value compared with control injected cells (Coninj, white bar). (B) The ER phenotype was quantitated by measuring the total cytoplasmic fluorescence of cells stained for the ER (see MATERIALS AND METHODS). In mutant cells (stippled bars), a marked reduction in total ER fluorescence is observed compared with control cells (white bars). Cells injected with inhibitory DLP1 antibodies (Inj, stippled bar) show a similar reduction compared with control injected cells (Coninj, white bar). Data were collected from cells either 16 h after transfection or 8 h after injection.

