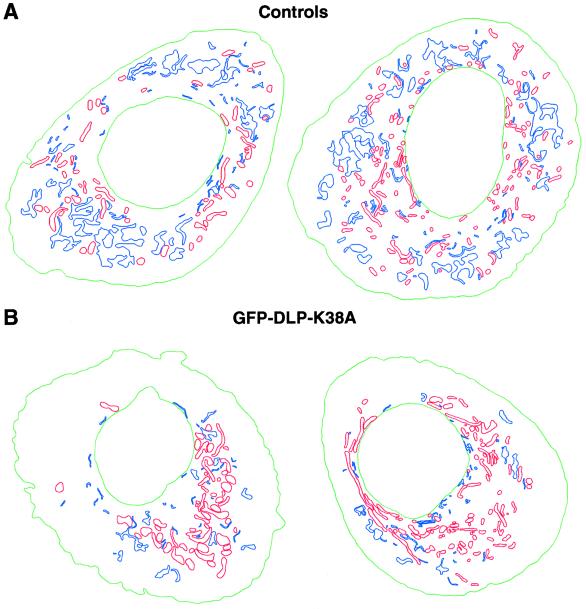
Figure 7.
Spatial analysis of ER and mitochondrial profiles in control versus GFP-DLP1-K38A–injected cells. Tracings of ER and mitochondria from two control cells or two GFP-DLP1-K38A–expressing cells. (A) Control cells exhibit a uniform distribution of numerous ER profiles (blue) and mitochondria (red). (B) In contrast, cells expressing GFP-DLP1-K38A show a striking reduction in the number of ER profiles (blue) and a marked collapse, swelling, and tubulation of mitochondria (red). Nuclei are shown in green.

