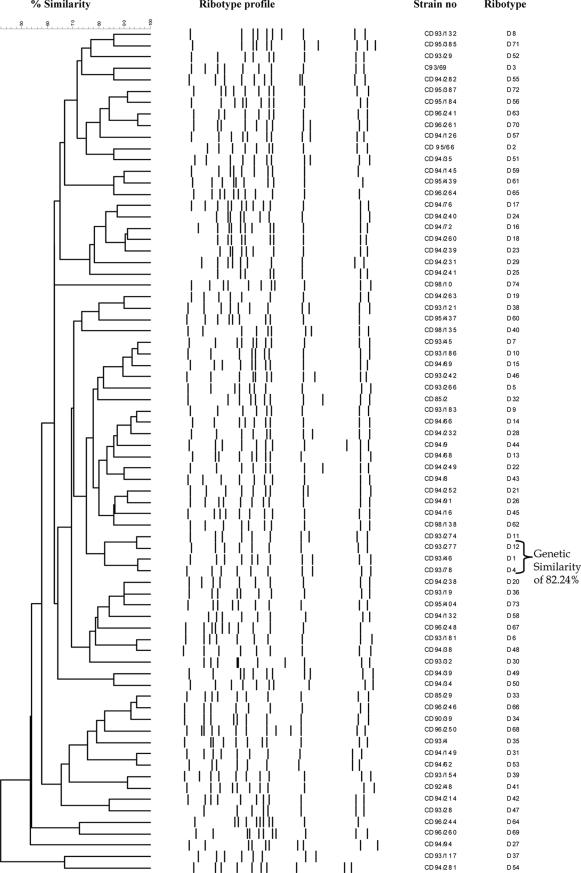
FIG. 2.
Comparison of the 74 ribotypes obtained by cluster analysis. The dendrogram was generated by using the Dice similarity coefficient, together with the unweighted pair group method with arithmetic averages clustering method, with the position tolerance set at 1.2% and the optimization set at 0.5%.

