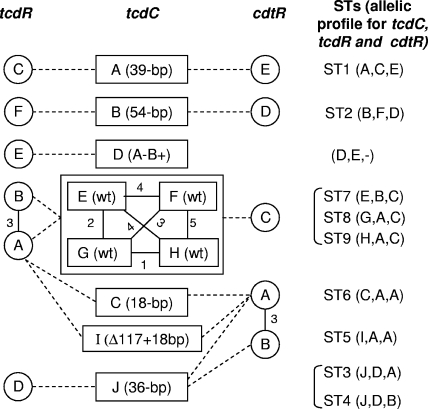
FIG. 3.
Diagram showing associations between tcdC, tcdR, and cdtR alleles among strains studied. The tcdC alleles are boxes A to J (midcolumn of the diagram) with the type of deletion in the tcdC gene (or the toxin type for the A− B+ toxin variants) noted in parentheses. Four close tcdC alleles, E, F, G and H, grouped in a box correspond to a wt tcdC gene. Open circles are tcdR alleles (A to F, left column). Gray circles are cdtR alleles (A to E, right column). Circles or boxes linked by a solid line represent close alleles; numbers beside the solid line represent nucleotide differences between alleles. Dashed lines represent relationships between the tcdC, tcdR and cdtR alleles. Corresponding STs are noted at the right of the diagram. tcdR and cdtR sequences were not determined for the unique tcdC F allele strain (AIP 81.07).

