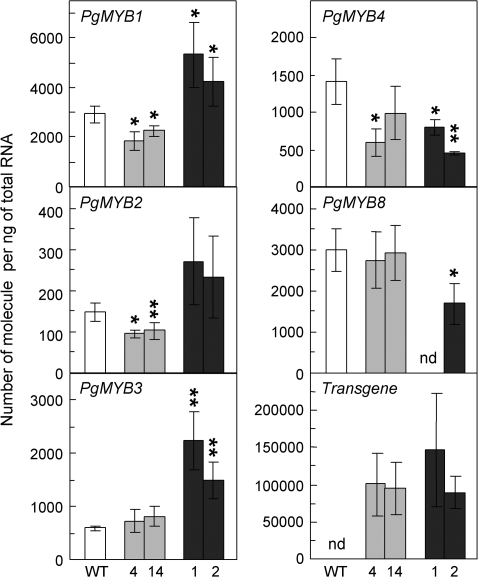
Fig. 5.
Transcript accumulation of endogenous spruce MYBs and pine transgenes in wild-type and PtMYB1 and PtMYB8 transgenic plantlets. For both transgenics, transcript accumulation was assessed by RT-qPCR on 3-week-old plantlets produced from two independent transgenic lines (L4 and L14 for PtMYB1, grey columns; L1 and L2 for PtMYB8, black columns). Transcript levels were normalized relative to EF1a expression level and were calculated using standard curves as described by Rutledge and Côté (2003). Bars represent means (±SD) from three biological replicates (15 plantlets per replicate). nd, Not detected. The significance of differential transcript accumulation (up or down) between control and transgenic plantlets was evaluated with Student's t-test (two-sample, unpaired, one-sided) at P ≤0.05 (*), or P ≤0.01 (*).

