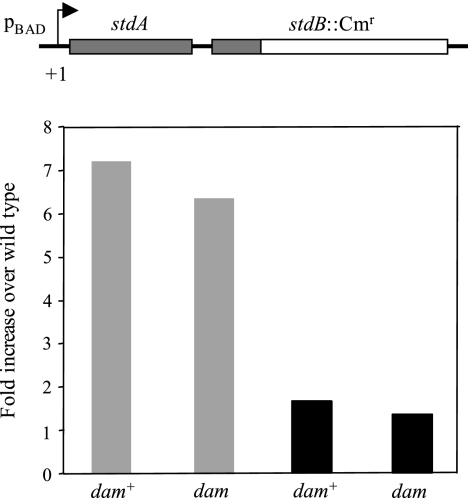
FIG. 3.
(Top) Diagram of the construction that permits std expression under the control of pBAD. (Bottom) Relative amounts of stdA mRNA transcribed from the heterologous pBAD promoter, normalized to ompA mRNA. Each bar represents the average from three independent experiments. Strains were grown in LB-arabinose (gray histograms) and LB-glucose (black histograms) media. Strains were SV5657 (dam+) and SV5658 (dam).

