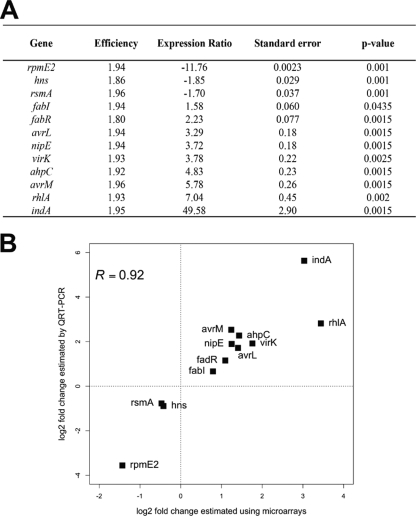
FIG. 2.
Validation of microarray results by qRT-PCR. (A) Expression ratios of genes in pecS mutant versus the wild-type strain measured by qRT-PCR. Expression of each gene was normalized to the expression of the two housekeeping genes, rpoA and ffh. A positive expression ratio indicates upregulated genes in the pecS background, and a negative expression ratio indicates downregulated genes in the pecS background. Standard errors were calculated from the data from three independent biological replicates. (B) Comparison of gene expression measurements by microarray hybridization and real-time qRT PCR. The correlation coefficient (R) is given.

