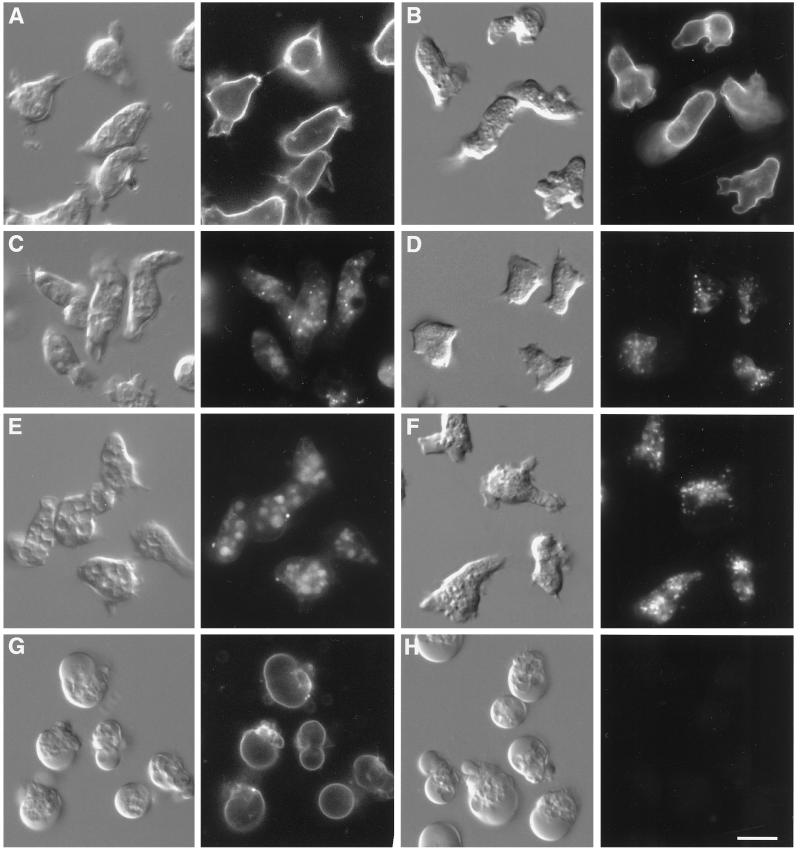
Figure 1.
FM1-43 internalization by individual Ax2 and NC4 cells. (A–F) Dye associated with Ax2 (A, C, and E) or NC4 (B, D, and F). (A and B) Surface fluorescence at 0 min after FM1-43 addition. (C and D) Cells incubated for 5 min with dye and then washed. (E and F) Same as C and D, but with an additional 25 min without dye. (G and H) Ax2 cells pretreated with azide, observed at 0 min after addition of dye (G) or after 5 min of incubation in dye and then washed (H). Differential interference contrast (DIC) images are on the left of each pair, and fluorescence images are on the right. Minor differences between pairs of DIC and fluorescence images are due to movement of the live cells. Bar, 10 μm.

