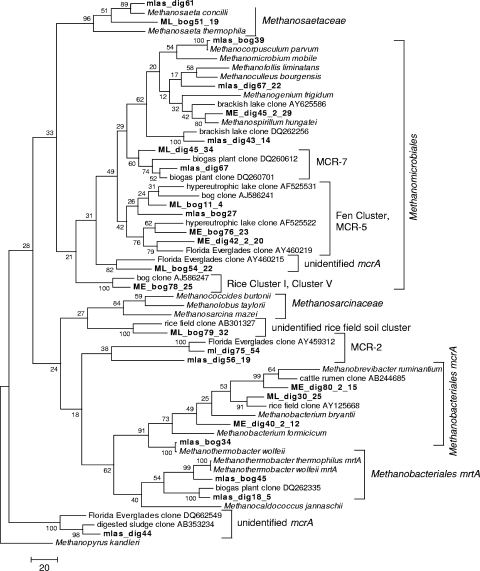
FIG. 3.
Phylogenetic tree for representative mcrA sequences (shown in Table S2 in the supplemental material) obtained from an acidic peatland (bog) and an anaerobic digester treating municipal wastewater sludge (dig). The tree was constructed as a maximum parsimony tree using close-neighbor interchange level 1 and bootstrapped with 100 trials. All positions containing gaps and missing data were eliminated from the data set. The scale bar represents the number of changes over the whole sequence. The classification of clusters is based on data described previously by Castro et al. (10) for MCR-2, MCR-5, and MCR-7; Juottonen et al. (32) for the fen cluster; Großkopf et al. (27) for rice cluster I, also named cluster V by Galand et al. (20); and Lueders et al. (41) for the unidentified rice field soil cluster.

