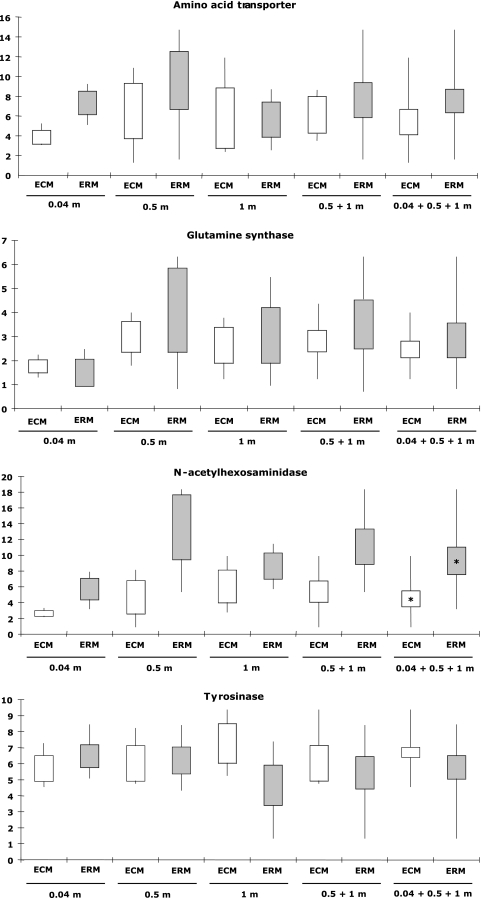
FIG. 2.
Quantification by qRT-PCR of the level of transcripts coding for glutamine synthase, amino acid transporter, N-acetylhexosaminidase, and tyrosinase in Lactarius quietus-Quercus petraea ECMs sampled in situ and in the extraradical mycelium surrounding soil (ERM). Raw values have been normalized using eIF-4 as a reference transcript. Data are expressed as the transcript level with respect to the control sample (mycelium grown on agar medium), the expression of which is set at 1. Values are the means of 3, 6, or 9 replicates: 0.04 m, 0.5 m, and 1 m (n = 3); metric variability (0.5 m plus 1 m) (n = 6); and metric and centimetric variability (0.04 m plus 0.5 m plus 1 m) (n = 9). The boxes (white, ECMs; gray, ERM) correspond to the standard deviation and the line to the maximum-minimum values of gene transcription. A t test was done for each transcript between transcript levels in ECMs and those in the extraradical mycelium surrounding soil. An asterisk indicates a P value of <0.05.

