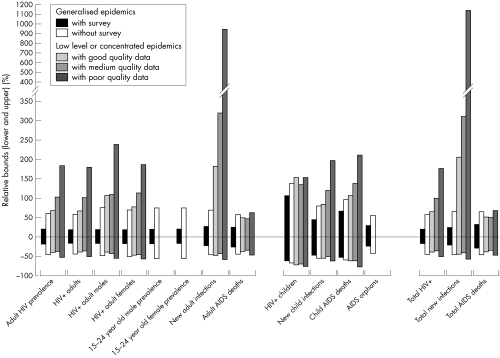
Figure 2 Ranges for key indicators in 2005 by type of epidemic expressed as mean percentages below and above the median value (for the raw data for this figure, and a colour version, please see http://www.stijournal.com/supplemental).

An official website of the United States government
Here's how you know
Official websites use .gov
A
.gov website belongs to an official
government organization in the United States.
Secure .gov websites use HTTPS
A lock (
) or https:// means you've safely
connected to the .gov website. Share sensitive
information only on official, secure websites.
