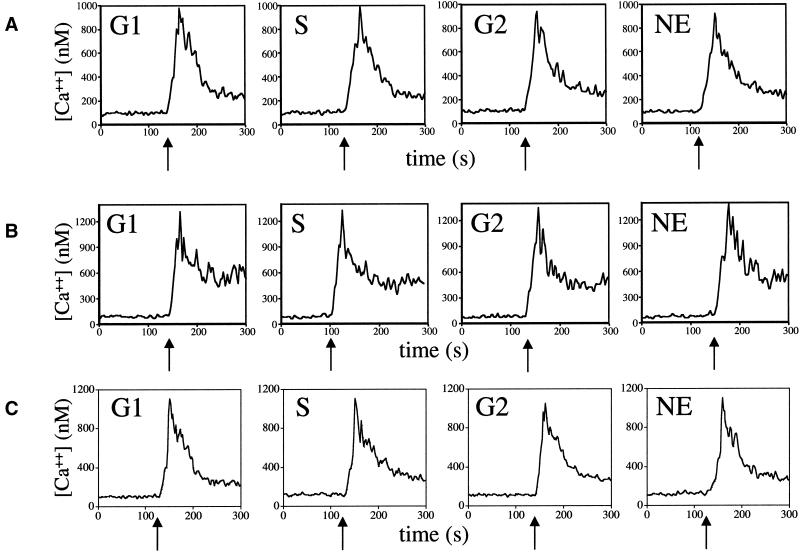
Figure 2.
Ca2+ fluxes in T cells after TCR activation. Basal intracellular free calcium levels in elutriated and nonelutriated CTL 1520 (A), Jurkat cells (B), and CD8+ T cell clone (C) loaded with Fura-2 were monitored spectrophotometerically as described in MATERIALS AND METHODS. Cells were stimulated with 10 μg/ml soluble OKT-3 mAb at the times indicated by arrows. Cell fractions are indicated as in Figure 1. Data are representative of at least two independent experiments.

