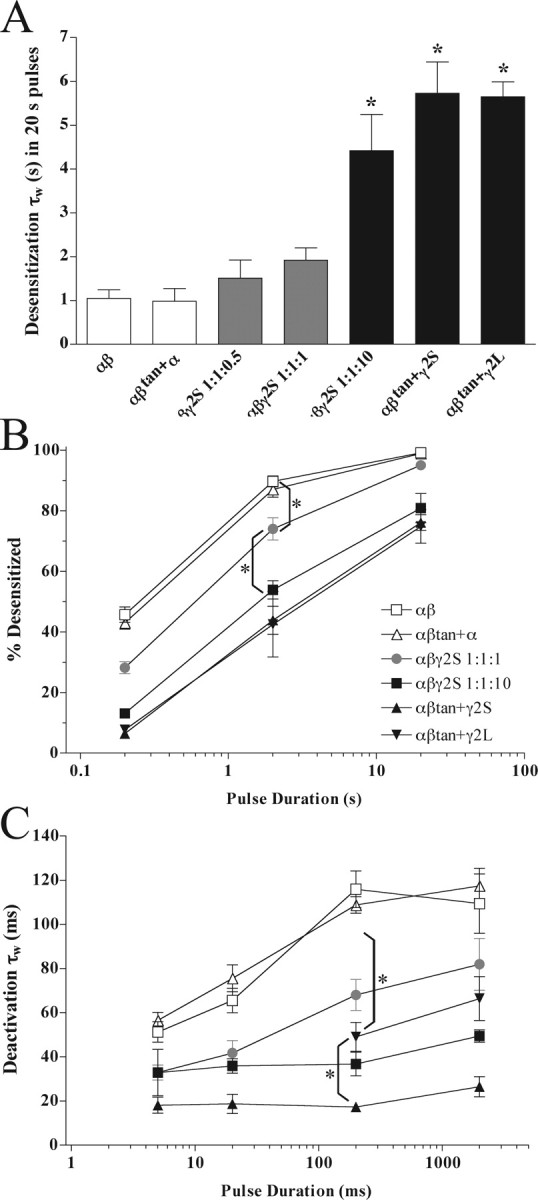
Figure 3.

Desensitization and deactivation profiles for different transfections. A, Weighted desensitization time constants (τw) differ betweenα1β2 or αβtan+α1 transfections (open bars) and α1β2γ2S 1:1:10 or αβtan+γ2S or γ2L transfections (black bars). Transfections with αβγ in a 1:1:0.5 or 1:1:1 ratio (gray bars) result in intermediate τw. Statistical comparisons reveal that αβ and αβtan+α1 transfections differ significantly from αβγ 1:1:10 and αβtan+γ2S transfections (*p < 0.001) but not from αβγ 1:1:0.5 or 1:1:1.αβγ 1:1:10 and αβtan+γ2S weighted time constants are not significantly different from each other. Data are mean ± SEM. B, Comparison of the percentage of the peak current remaining at the ends of 10 mm GABA pulses of varying length. Percentage desensitization was calculated as follows: 1 – (current amplitude at pulse end/peak current) × 100%. Transfections with α1β2γ2S 1:1:1 (gray circles) result in values intermediate to α1β2 and αβtan+α1 (open symbols) versus α1β2γ2S 1:1:10, αβtan+γ2S, and αβtan+γ2L transfections (closed symbols). This difference is most clearly observed at the ends of 2 s pulses (*p < 0.001 compared with α1 β2 γ2S 1:1:1 transfections). Data are mean ± SEM. C, Weighted deactivation time constants for GABAA subunit transfections. Deactivation time constants (τw) for α1β2 and αβtan+α1 transfections (open symbols) and α1β2γ2S 1:1:10, αβtan+γ2S, and αβtan+γ2L transfections (closed symbols). Transfections with α1β2γ2S 1:1:1 (gray symbols) result in intermediate time constants in pulses of 200 or 2000 ms (*p < 0.01 compared with α1β2γ2S 1:1:1 transfections). Data are mean ± SEM. Components of each weighted time constant are listed in Tables 1 and 2.
