Figure 5.
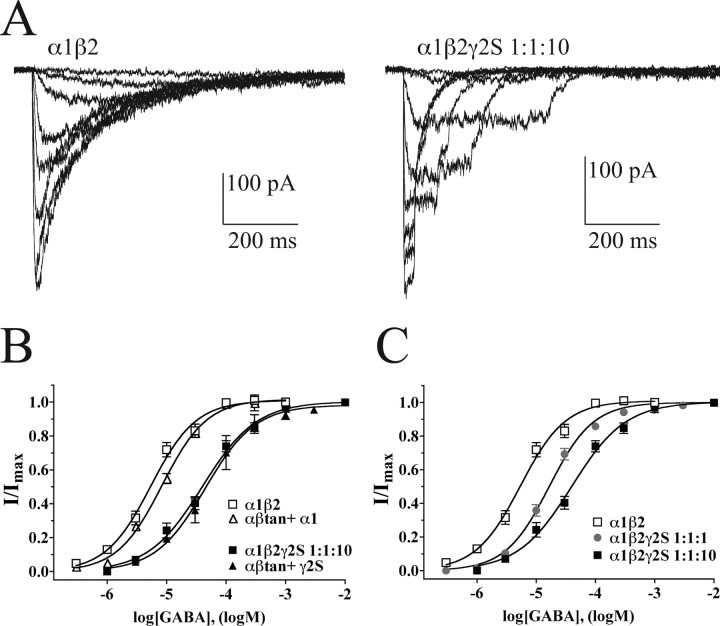
GABA concentration responses. A, Current responses to increasing concentrations of GABA for α1β2 transfections (with 0.3, 1.0, 3.0, 10, 30, 100, 300, and 1000 μm GABA) and α1β2γ2S 1:1:10 transfections (with 1, 3, 10, 30, 100, 300, 1000, and 3000 μm GABA). Pulse durations are described in Materials and Methods. Note that less desensitization occurs in α1β2γ2S 1:1:10 at any given concentration. B, C, Concentration–response curves and fits for α1β2 and αβtan+α1 (open symbols) versus α1β2γ2S 1:1:10 and αβtan+γ2S (closed symbols) transfections (B) or α1β2γ2S 1:1:1 transfections (C, gray circles). Currents were normalized to a maximal response at a GABA concentration 10-fold higher than the curve-fit maximal responses shown. Data shown are means ± SEM for four or more patches each. In some cases, the error bars were smaller than the symbol for the mean. Note that 1 mm GABA is near-maximal for all combinations shown.

