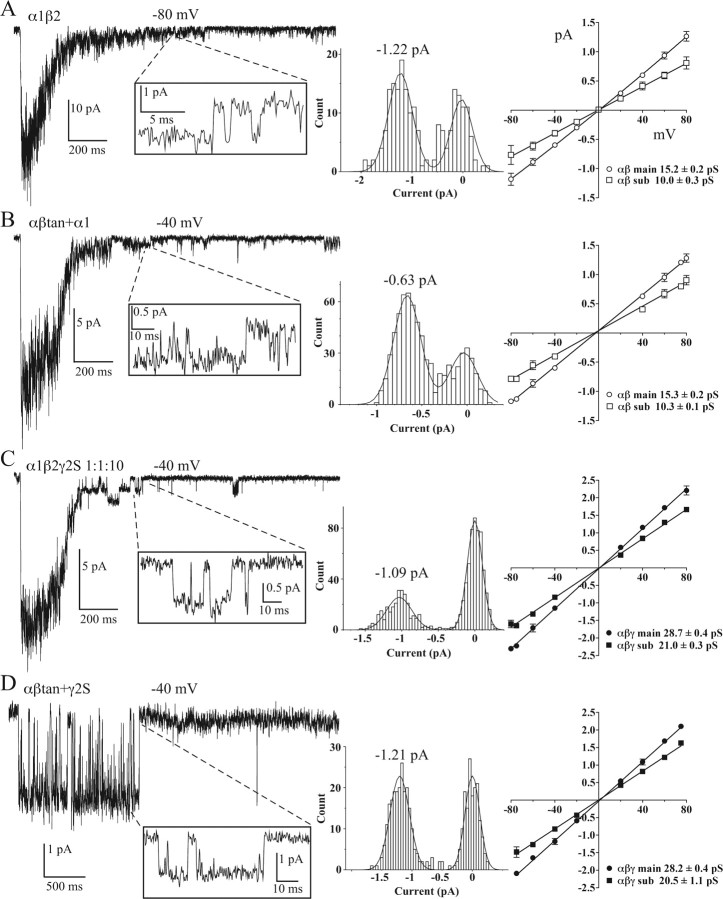
Figure 6.
Single-channel openings and conductances. A–D, Representative current traces for α1β2 (A), αβtan+α1 (B), α1β2γ2S 1:1:10 (C), and αβtan+γ2S (D) transfections showing single-channel openings in tail currents after deactivation from a 200 ms, 10 mm GABA pulse or during the pulse in the case of D. All points amplitude histograms (center) of the closed and open levels for the openings indicated (insets) and Gaussian fits. Current–voltage plots were constructed for each of the transfections(right). Calculated chord conductances are listed beneath each plot for main and subconductances. Data are mean ± SD from three or more patches.

