Figure 8.
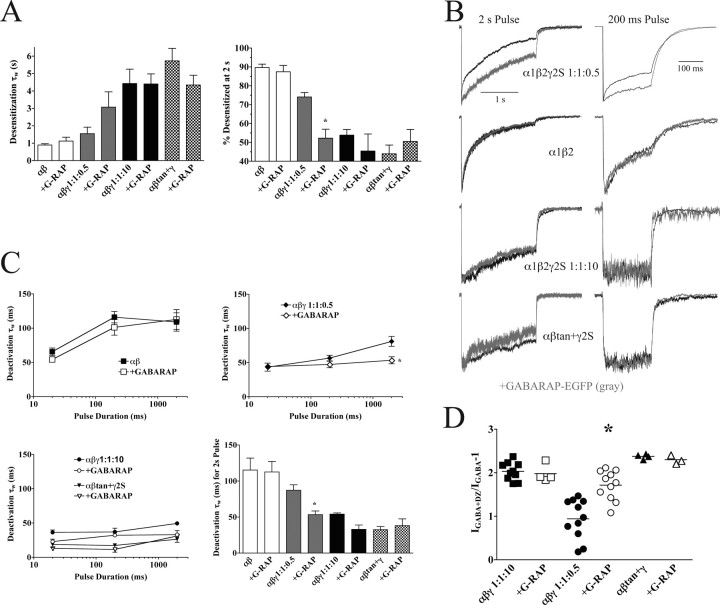
Coexpression of GABAA subunits with a GABARAP-EGFP fusion protein. A, Summary of effects of GABARAP-EGFP on desensitization. Desensitization weighted time constants (τw) for each of the transfection types are shown in the left panel, compared with the extent of desensitization in the right panel. Data are mean ± SEM. The asterisk denotes significant difference from the non-GABARAP transfection at p < 0.01. B, Representative current traces (black traces) of α1β2γ2S 1:1:0.5 (top), α1β2 (second row), α1β2γ2S 1:1:10 (third row), and αβtan+γ2S transfections (bottom) overlaid with current traces from the same subunits cotransfected with GABARAP-EGFP (gray traces). GABA pulse durations shown are 2000 ms (left) to show changes in desensitization and 200 ms (right) to show changes in deactivation. C, Summary of effects of GABARAP-EGFP on deactivation. Deactivation weighted time constants (τw) following GABA pulses of 20, 200, and 2000 ms duration are shown for αβ (top left panel), α1β2γ2S 1:1:0.5 (top right), α1β2γ2S 1:1:10, and αβtan+γ2S transfections (bottom left) with (closed symbols) and without (open symbols) coexpression of GABARAP-EGFP. The bottom right panel summarizes data for the 2000 ms GABA pulse. Data are mean ± SEM. The asterisk denotes significant difference from the non-GABARAP transfection at p < 0.05. D, Effects of cotransfection of GABARAP-EGFP on diazepam-induced potentiation of subsaturating GABA responses. Each point represents data from one patch pulsed for 500 ms with 3 μm GABA for several sweeps and then equilibrated in 1 μm DZ and pulsed with 3 μm GABA plus 1 μm DZ. Peak currents were measured preincubation and postincubation with DZ, and potentiation was calculated as follows: IGABA+DZ/IGABA – 1. Horizontal lines represent the mean. The asterisk denotes significant difference from the non-GABARAP transfection at p < 0.001. G-RAP, GABARAP.

