Figure 9.
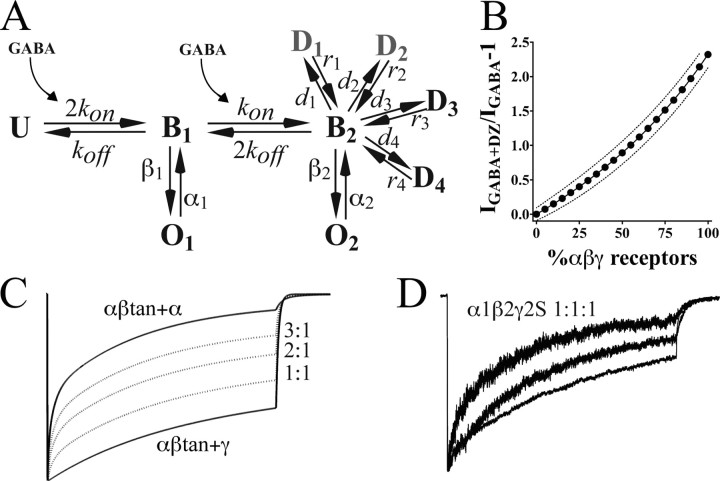
Model of currents for αβ receptors compared with αβγ receptors. A, Kinetic scheme. Using a backbone kinetic model with one unbound (U) state, single-liganded (B1) and double-liganded (B2) states, and an open state (O1,O2) from each of the liganded states (Jones and Westbrook, 1995; Hinkle and Macdonald, 2003), currents for αβtan+α1 versus αβtan+γ2S were simulated (see Materials and Methods). Parameters optimized were desensitization and deactivation time constants, apparent affinity (EC50), and open probability for macroscopic currents. A simplified model for αβtan+α1(αβ) receptors had the following rates: kon, 5 × 10⁶–1 s–1; kon, 100 s–1; β1 (B1 to O1), 200 s–1 m;α1 (O1 to B1), 1100 s–1; β2, 1800 s–1; α2, 280 s–1. The model for αβtan+γ2S (αβγ) receptors used the following rates: kon, 5 × 10⁴–1 s–1; kon, 200 s–1; β1 (B1 to O1), 50 s–1 m; α1 (O1 to B1), 3100 s–1; β2, 1800 s–1; α2, 280 s–1. Both models differ dramatically in their desensitization (d) and recovery (r) rates. For αβtan+α1 receptors, faster entry desensitized states (D1, D2, gray) were connected to B2 with the following rates: d1, 200 s–1; r1, 80 s–1; d2, 60 s–1; r2, 12 s–1. Slower entry D states (D3, D4) were modeled with the following rates: d3, 12 s–1; r3, 0.03 s–1; d4, 6 s–1; r4, 0.3 s–1. For the two relatively slow desensitizing components seen in αβtan+γ2S currents (also designated D3 and D4), the rates were as follows: d3,2s–1; r3, 0.75 s–1; d4,1s–1; r4, 0.05 s–1. B, Model of diazepam potentiation for varying amounts of αβ and αβγ receptors in a mixture. Experimentally determined values for maximal diazepam potentiation (IGABA+DZ/IGABA – 1), EC50, open probability, and conductance for both αβ and αβγ receptors were used to generate the curve of expected values and 95% confidence intervals (see Materials and Methods). C, Simulated model traces for αβtan+α1 and αβtan+γ2S (bold), with averaged traces generated from mixtures of αβtan+α1 and αβtan+γ2S receptors in a 3:1, 2:1, and 1:1αβtan+α1:αβtan+γ2S ratio (dotted line). D, Traces from three excised patches from cells transected at a 1:1:1 α1:β2:γ2S ratio, showing variability in macroscopic kinetics.

