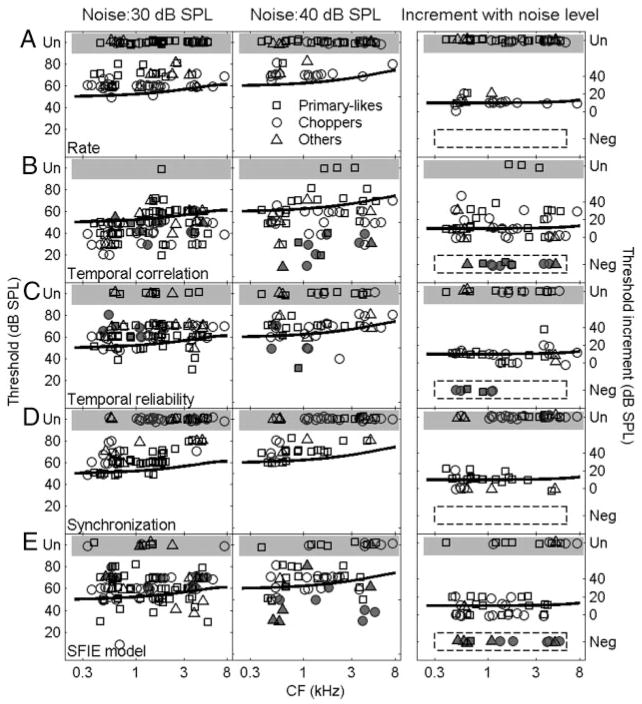
FIG. 6.
Left and middle columns: detection thresholds based on (A) average dischare rate of the neuron, (B) temporal correlation, (C) temporal reliability, (D) synchronization to the tone, and (E) SFIE model discharge rate at noise spectrum levels of 30 (left) and 40 (middle) dB SPL. Shaded areas, label Un, indicate no measurable detection threshold up to the highest tone level tested (45, 1, 12, 39, and 11% of neurons for 30-dB SPL noise, and 67, 5, 27, 56, and 23% of neurons for 40-dB SPL noise, based on the measures of A–E, respectively). Solid lines represent psychophysical detection thresholds of the cat (Costalupes 1985) corrected for noise duration (Wier et al. 1977). Right column: increase of detection threshold for each neuron when noise spectrum level increased from 30 to 40 dB SPL, for neuron that were tested at both noise levels. Shaded areas, labeled Un, indicate neurons with unmeasurable thresholds at 40 dB SPL noise spectrum level. Shaded symbols circled by dashed lines, labeled Neg, indicate neurons with lower thresholds at 40 dB SPL, including those neurons that had unmeasurable thresholds at 30 dB SPL but measurable thresholds at 40 dB SPL noise spectrum level (these neurons are also marked in the left and middle panels as shaded symbols). Solid lines in the right panels represent increase in psychophysical detection threshold when noise level was increased by 10 dB. For the purpose of illustration, small jitter drawn from a Gaussian distribution with SD of 1 dB SPL was added to threshold value to avoid completely overlapping symbols.

