
FIG. 7.
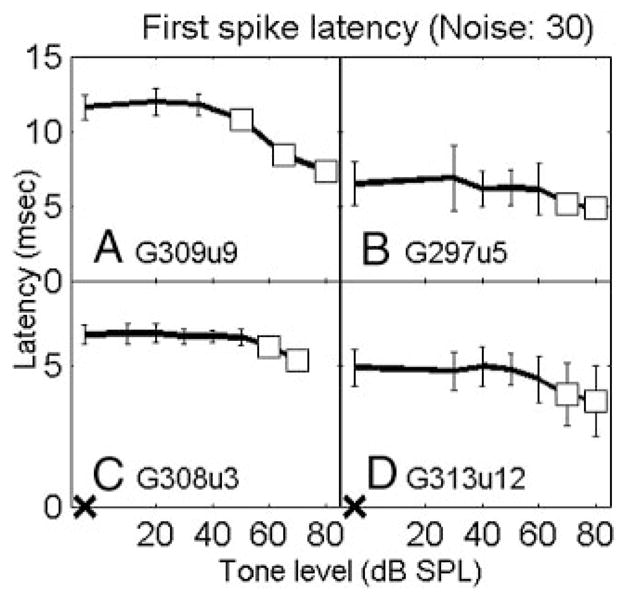
First-spike latencies for the 4 representative neurons in response to tones in noise. A–D correspond to the 4 neurons in Figs. 2–5, respectively. Noise spectrum level was 30 dB SPL. Open squares indicate signficant decrease in the first-spike latency to tone-plus-noise condition compared with noise-alone condition (d′ ≥ 1). X on the abscissa indicates response to noise alone.