
FIG. 8.
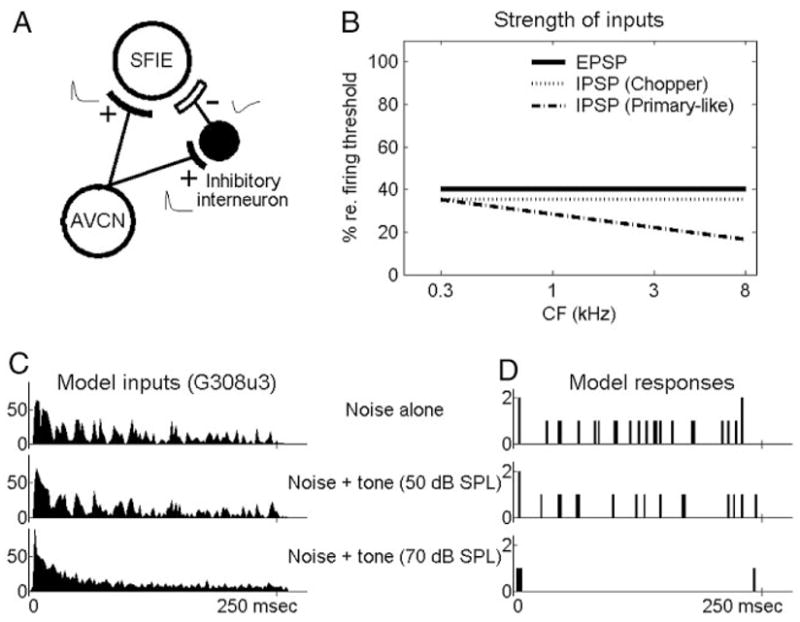
A: schematic diagram of the same-frequency inhibition and excitation (SFIE) model. B: strength of excitatory postsynaptic potentials (EPSPs) and inhibitory postsynaptic potentials (IPSPs; value 100% was equivalent to excitatory strength of a single input action potential that just caused the membrane potential to reach discharge threshold). C: PSTHs of a chopper nueron (unit shown in Fig. 4) describing the inputs to the model. D: model responses. In C and D, top panels correspond to a noise at 30 dB SPL spectrum level; the middle and bottom panels correspond to the same frozen noise plus a 50 (middle) or 70 (bottom) dB sPL tone. Bin width = 2 ms. + and − signs indicate excitatory and inhibitory inputs, respectively, and illustrative EPSPs and IPSPs are plotted beside the + and − signs.