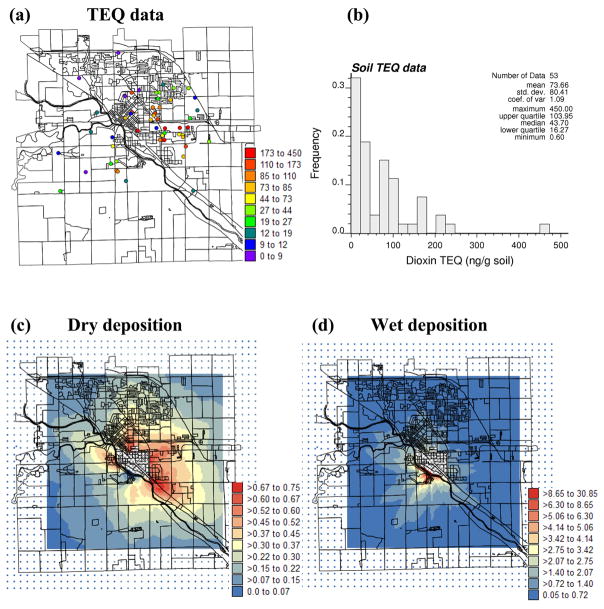
Figure 1.
Location map of 53 TEQ data (a) and the corresponding histogram (b). Bottom maps show the grids of 5-year dry (c) and wet deposition (d) values predicted by the dispersion model (units= μg/m2). The outlines of census blocks are displayed in background and the central hatched area denotes the plant property.

