
Figure 2.
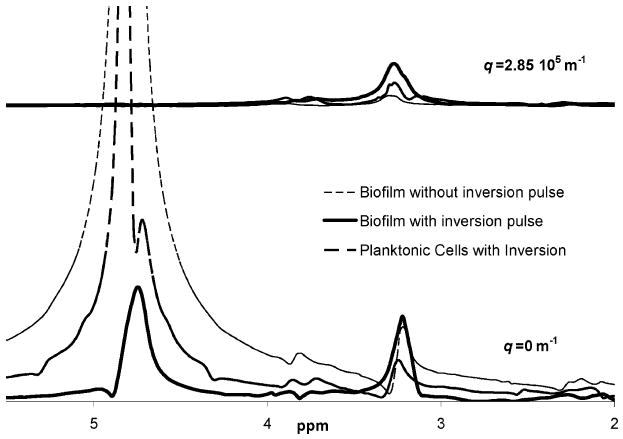
Biofilm before and after inversion. The thin black dashed line shows the dominance of the bulk water signal if the T1 inversion recovery pulse is not utilized. The spectra from a fresh biofilm after a T1 inversion recovery pulse is shown with the bold black line and compared to the spectra from a sample of planktonic cells (dashed grey line). The bottom spectra are obtained with no diffusion encoding gradient pulses (q = 0 m−1), while the upper spectra are obtained with the largest amplitude diffusion encoding gradient pulses (q = 2.85 × 10⁵ m−1). Note that the inversion recovery pulse allows information to be obtained form all spectral peaks at all q values.