
Figure 7.
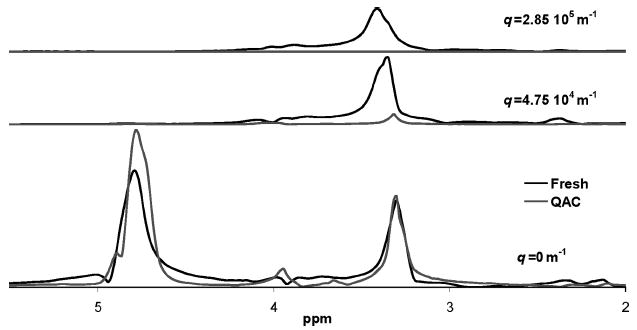
Fresh and QAC-treated biofilm biomass spectra. This comparison of biofilm treated with 50 mg/L quaternary ammonium compound (QAC) to an untreated biofilm sample shows that the amount of rotationally free compounds in the two samples are similar. This is shown in the bottom graph without any gradient. At higher gradient values, the 3.3 ppm peak present in the fresh biofilm is not present in the QAC-treated sample. There are no peaks visible at higher gradient values in the QAC sample. Thus, QAC has permeabilized the cell wall and molecules no longer show translational restriction due to confinement within stationary cells.