Figure 2.
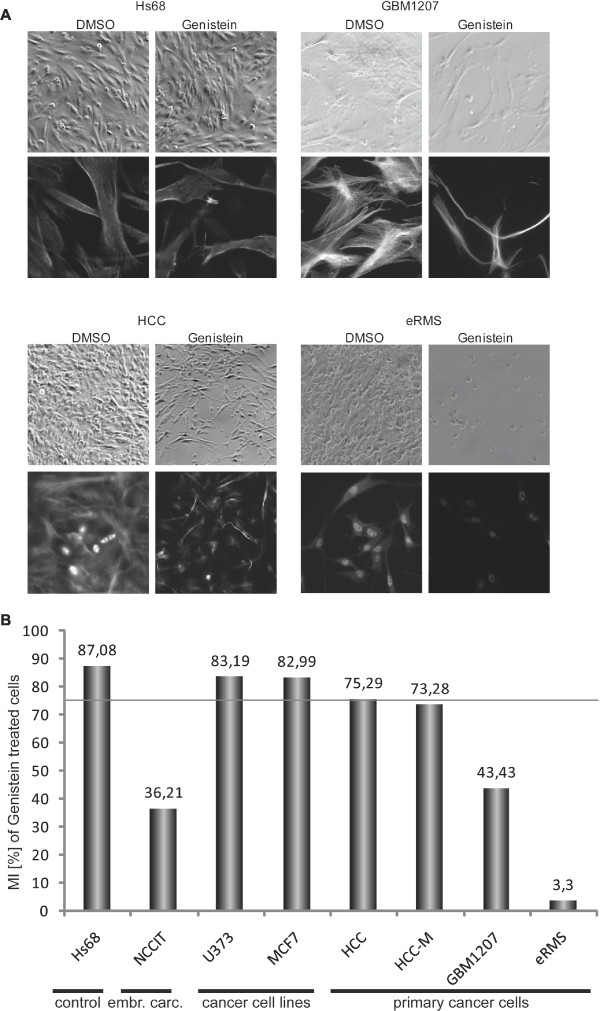
Morphology and mitotic index of genistein treated cells. (A) Phase-contrast and immunofluorescence micrographs of untreated (DMSO) and treated (50 μM genistein/48 h) cells. Hs68 cells serving as negative control did not show changes in morphology upon treatment. Genistein-treated cancer cell lines in comparison (GBM1207, HCC, HCC-M) show clear morphological changes, resembling a more fibroblast-like type. (B) The effect of genistein treatment on 8 different cell lines was investigated by calculating the mitotic index of each sample. Frequency of mitosis in each matching DMSO-control was set as 100% for each cell line and the relative decrease upon treatment was calculated. The threshold for significance was set to 75% mitoses (grey line). Hs68 cells served as negative control (MI >87% after treatment). Interestingly, both cell lines (MCF7 and U373) also showed only mild response to the treatment and mitotic indices were preserved at levels >82% compared to the corresponding control. In NCCIT cells as well as primary cancer cells, the observed effect on levels of mitosis was significantly high. Mitosis rates were as low as 3,3% (eRMS); 36,21 (NCCIT); 43,43% (prim. GBM); 73,28 (metastasis of HCC).

