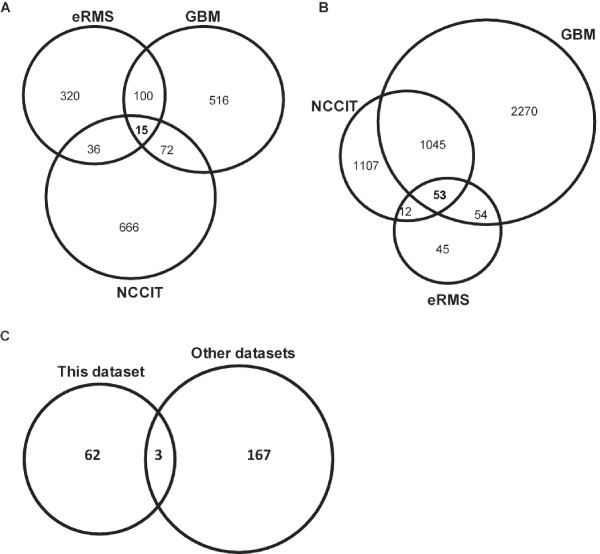
Figure 3.
Cell-type comparison of differentially regulated genes after Genistein treatment. Venn diagram illustrating distribution of down-regulated (A) and up-regulated (B) genes after genistein treatment compared to their respective DMSO-controls. The description of the common regulated genes is given in Additional file 3. (C) Venn diagram of differentially regulated genes identified in our study, compared to [29-31].

