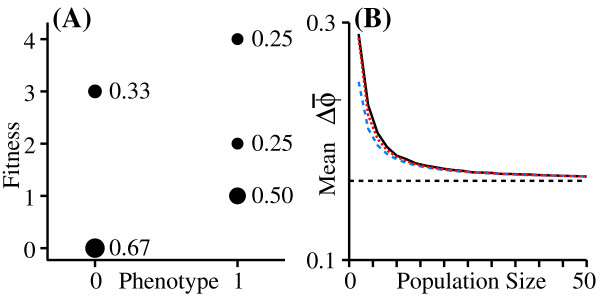
Figure 5.
Approximating the curve of using moments. A fitness distribution (A) and the corresponding expected change in mean phenotype for different population sizes (B). The solid black curve in (B) is the curve resulting from 100,000 monte-carlo runs per value of N. The dashed blue line in (B) shows the result of using Equation 17 and considering only the first two terms in the expansion (up to and including var()). The dashed red line shows the result of using the first four terms of the expansion (up to and including μ4()).

