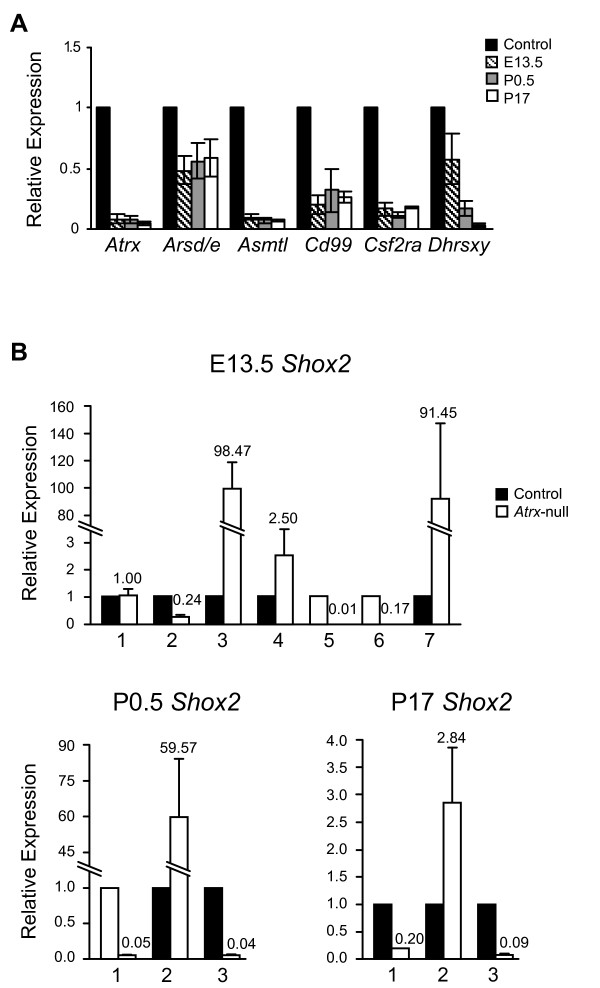
Figure 2.
Relative expression of ancestral PAR genes in ATRX-null mouse forebrains. (A) Real-time quantitative RT-PCR of the indicated PAR1 genes showed a decrease in expression in the Atrx-null mouse forebrain. RNA was isolated from littermate-matched Atrx-null and control embryos/mice at E13.5, P0.5 and P17. Results were normalized to β-actin expression levels. Error bars represent standard error of the mean between biological replicates (n = 3). (B) Expression of Shox2 in seven (E13.5) or three (P0.5 and P17) littermate-matched pairs. Error bars represent standard error of the mean for technical replicates. In (A) and (B) expression levels for the control forebrains were set to one for each reaction (represented by the black bars).

