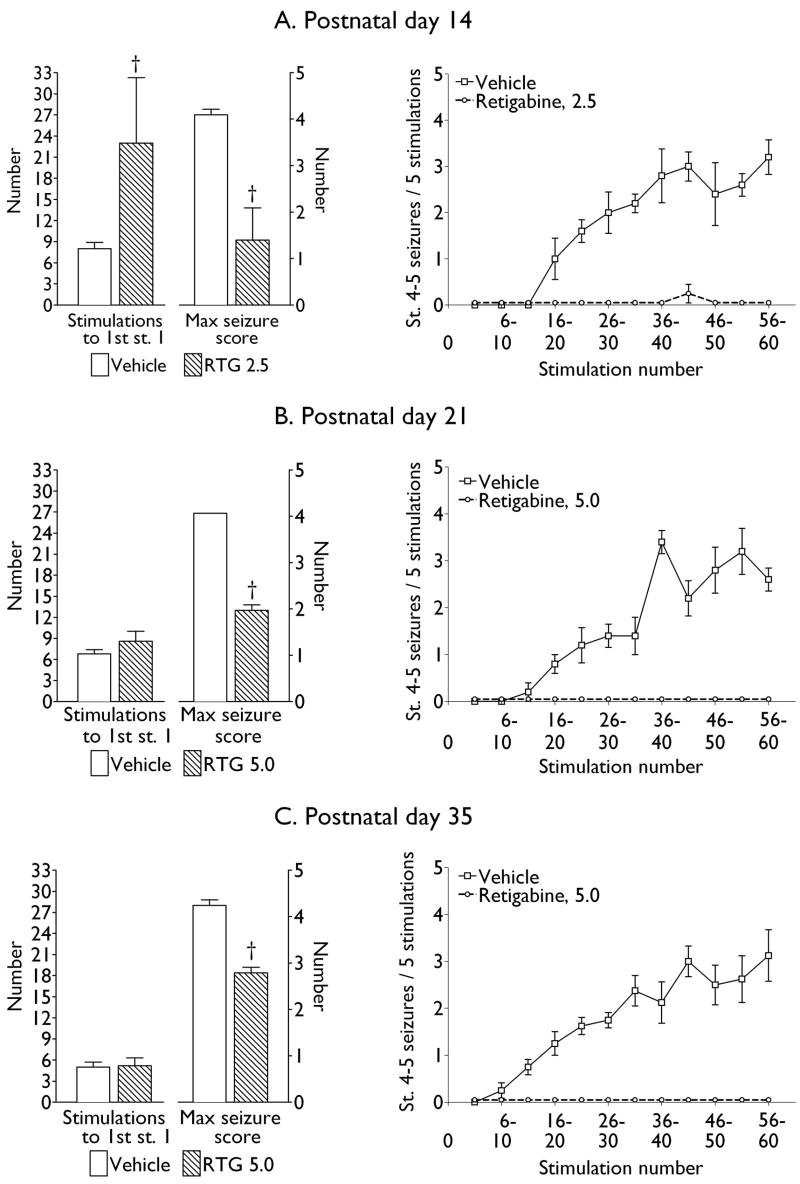
Fig. 4. The effects of retigabine on kindling acquisition.
Left: Bar graphs show number of kindling stimulations required to reach first stage 1 seizure, as well as maximal score of behavioral seizures observed during rapid kindling. Right: Line graphs show the progression of full kindled seizures, expressed as the number of stage 4–5 convulsions recorded in response of 5 consecutive kindling trials. Data are presented as Mean ± SEM. Dagger – p < 0.05 vs. Vehicle (Student t-test).

