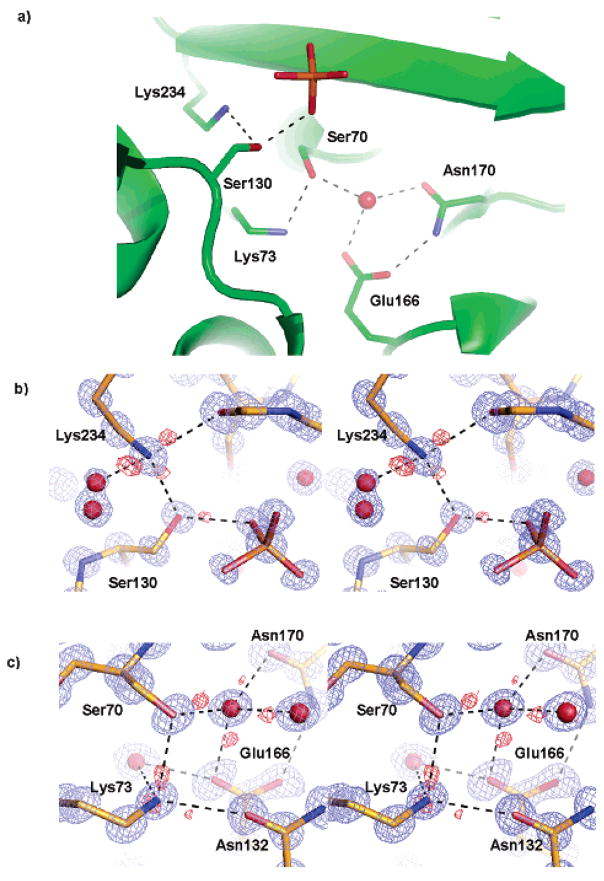
Figure 3.
Hydrogen bonding (dashed lines) in the active site. 2Fo–Fc map (blue) and Fo–Fc map (red) are both contoured at 3σ. (a) Active site configuration showing the key catalytic residues, the catalytic water, and a phosphate molecule. (b) Protons of Lys234Nζand Ser130Oγ, identified by Fo–Fc map, shown in stereoview. (c) Hydrogen bonds among Ser70, Lys73, Glu166, and the catalytic water shown in stereoview.

