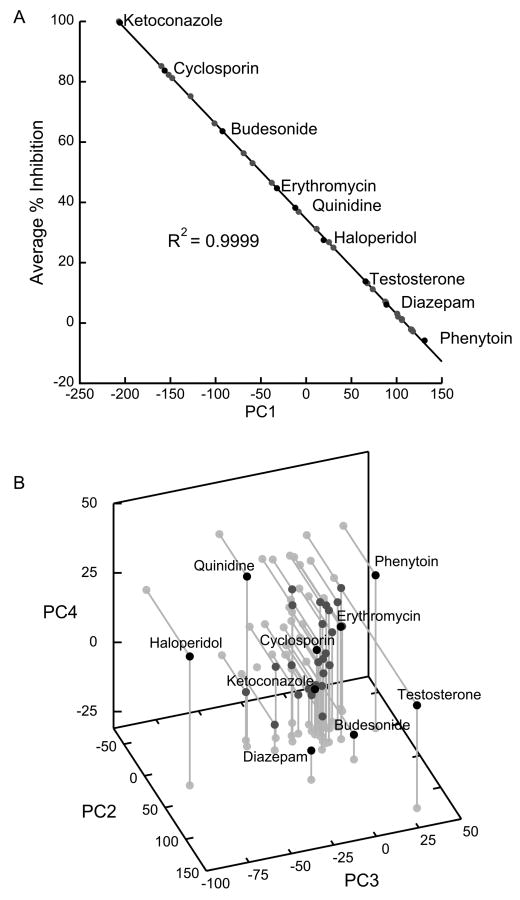
Figure 2.
PCA of transposed CYP3A4 inhibition/activation data from ref. (Kenworthy et al., 1999), showing how inhibitors from the panel cluster in functional space. Only selected inhibitors (black dots) are labeled. a) Inhibitor score PC1 is almost entirely determined by the average inhibition, a function of the average [I]/KI for each inhibitor ([I] = 30 μM in the experimental conditions). b) Functionally relevant characteristics of the various inhibitors are encapsulated in the 2nd through 4th PCs. Under experimental conditions, testosterone is the most atypical inhibitor in the panel, followed by haloperidol.

